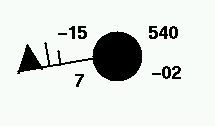
 Upper Air - Station Plots
1) What is the observed temperature in Amarillo, Texas?
2) What is the dewpoint temperature in Amarillo?
3) What is the dewpoint temperature in Oklahoma City?
4) What does the number to the upper right mean?
5) What does the number to the immediate right of the station mean?
6) What is the wind speed and direction in Centerville, Alabama?
7) What would it mean if the circle is filled in?
8) If I were at 850 mb, what height is 146?
9) If I were at 700 mb, what height is 126?
10) On the 250 mb chart, there is shading in of isotachs. What are
these?
11-20.) Decode the surface plot.
